
What Happens When You Remove the Lies From a Trading Backtest? 860 Strategy Configurations on 22 Years of EURUSD
Every trading robot you’ve ever seen advertised has the same screenshot. A tidy equity curve rising from bottom-left to top-right, a “+180% over 10 years” in the corner, and a list of stats that look like they came from a hedge fund.
The backtest is fiction. Not because the math is wrong, but because the kitchen it was cooked in doesn’t exist.
It was cooked in a fantasy kitchen where:
- Buying and selling is free; no spread, no slippage
- The market always fills you at the perfect price
- Your stop-loss fills at a price the market never actually traded
- The strategy was tuned on the exact same data used to “prove” it works
- And the results were never saved in a way anyone can verify
Every one of those is a lie beginners can’t see. This article is about how I built an engine designed to make those specific forms of backtest leakage and optimistic execution impossible. And what happened when I ran the two most popular trading strategies in the world through it.
Why I built it
I got tired watching people lose money to “+180% backtested!” claims. Not because the claims are always malicious — sometimes the seller genuinely believes their backtest. The problem is deeper and uglier; the backtesting tools everyone uses are themselves optimistic.
Take the industry standard, MT’s strategy tester. Its “Every Tick” mode doesn’t replay real market ticks. It reconstructs a plausible-looking path from four numbers per minute (open, high, low, close) using an interpolation algorithm, then executes your orders against a price sequence that never happened. MetaTrader’s own documentation sets a 90% modeling-quality cap on this mode — a documented admission that the engine is not replaying reality.
The spread, cost of every real trade, is taken from the first tick of each minute and applied for the entire minute. Real EURUSD costs 0.2 pips during the London–New York overlap and 3 pips during a news release. The tester can’t see any of that. It just sees one spread applied 60 times.
So a professional backtest of a strategy that wins 10 pips/trade and loses 3 pips to execution, before spread widening news, shows profit. Live, it’s flat. The backtest was never truly testing the strategy. It was a test of how the interpolator behaved on the strategy. I wanted a machine that couldn’t do that. So I built one.
The 3 structural rules
My engine has three rules that are enforced in the design, not “hoped for” in the configuration:
No peeking
A signal may only use bars that have closed. You see the close, you decide, and you trade the next bar’s open. No hypothetical fills in the middle of a candle, no “I would have bought at that exact low”. The future is physically unavailable to the strategy.
Real costs, always
Spread and slippage are charged on every single trade, both sides. And there’s a rule most backtests skip: gap-through-stop. If a market gaps past your stop-loss, you don’t get to fill at your stop price — that’s the idealized lie. You fill at the worse of your stop and the opening price. The trade that gapped through your stop is marked at the price you’d actually have gotten. This one rule alone kills the profitability of more proven strategies than any other.
Reproducibility, or it never happened
Every run writes a manifest recording the exact data file (its SHA-256 hash), every parameter, every cost assumption and the exact code version. If asked whether you can reproduce the result, the answer is yes — and here’s the hash proving the data was never swapped. No cherry-picking after the fact.
What I tested
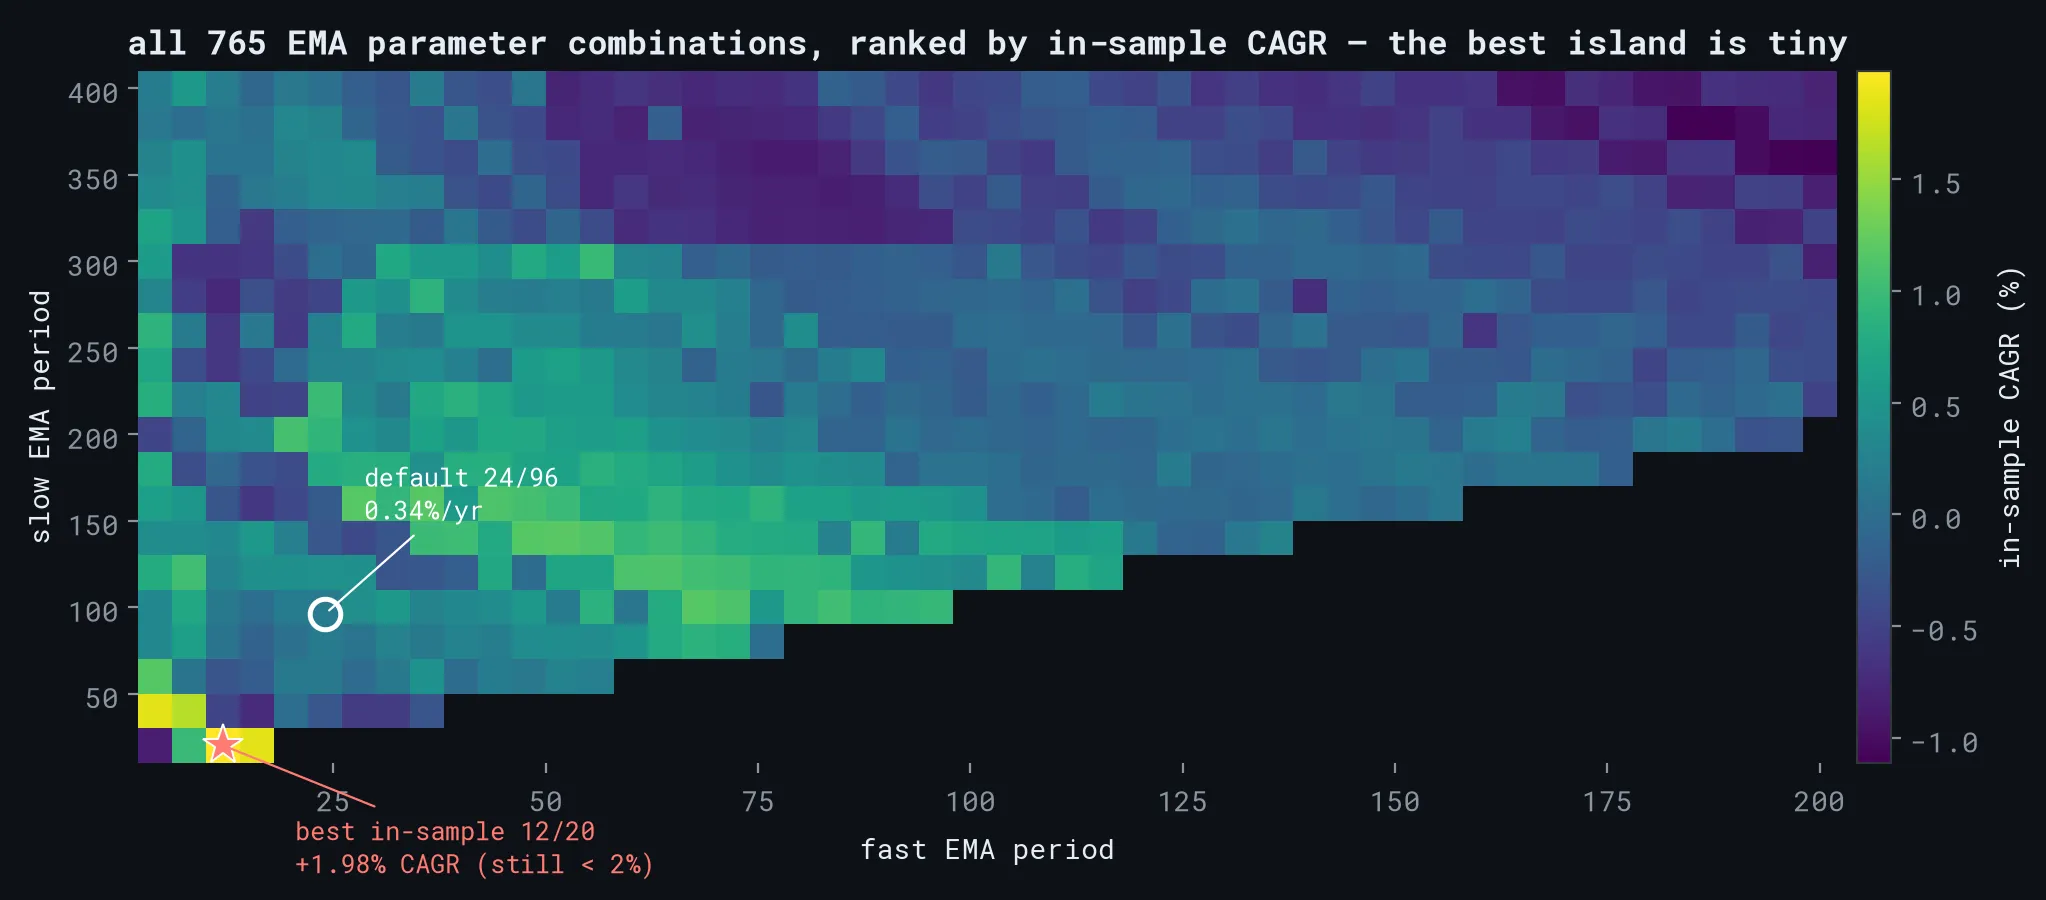
I ran two strategy families across their entire parameter space — 860 combinations in total — over 23.4 years of daily EURUSD candles.
EMA crossover (765 combinations)
The classic: when the fast moving average crosses above the slow one, buy; when it crosses below, sell. It’s the first strategy most retail traders encounter, and variations of it are everywhere in retail algorithmic trading.
- Best combination in-sample: +1.98% CAGR
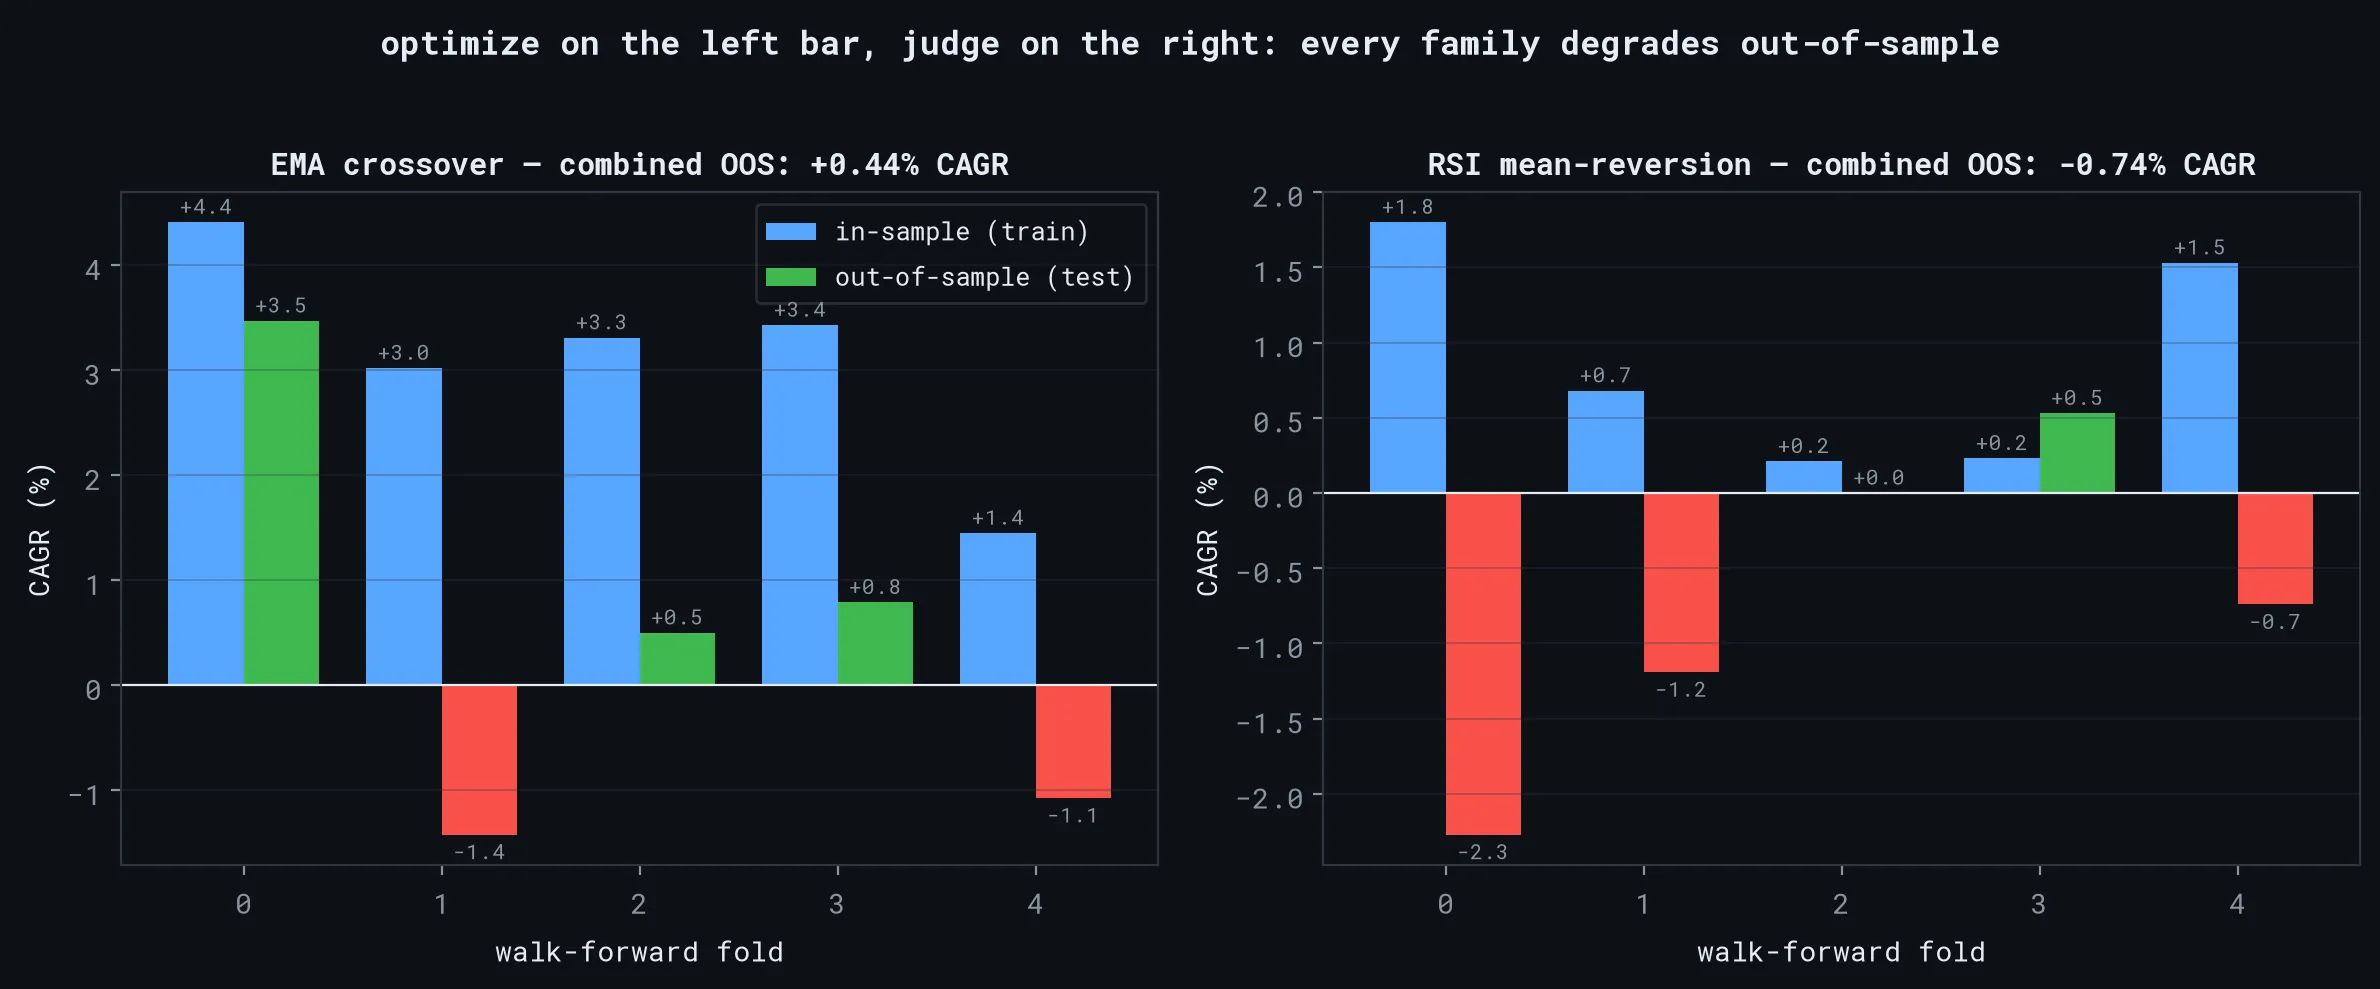
- The same strategy, on data it never saw (walk-forward, 5 folds): +0.44% CAGR
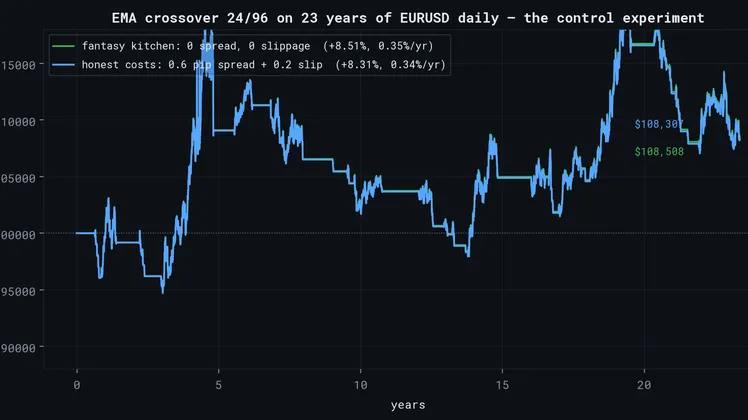
- Default settings (24/96): +8.31% total over 22 years, that’s 0.34% a year. Forty-nine trades. A 17% maximum drawdown.
RSI mean-reversion (95 combinations)
When the RSI hits an “oversold” level, buy expecting a bounce.
- Best in-sample: +0.14% CAGR — the entire 95-combination space never beats 0.15% a year, even before you question robustness
- Out-of-sample (walk-forward, 5 folds): −0.74% CAGR — it loses money on data it was never shown
The experiment nobody ever runs
I ran the control test. I gave the EMA strategy the fantasy kitchen it was always denied — zero spread, zero slippage, free trading, 22 years.
The result: +8.51% total. Barely different from the +8.31% with honest costs.
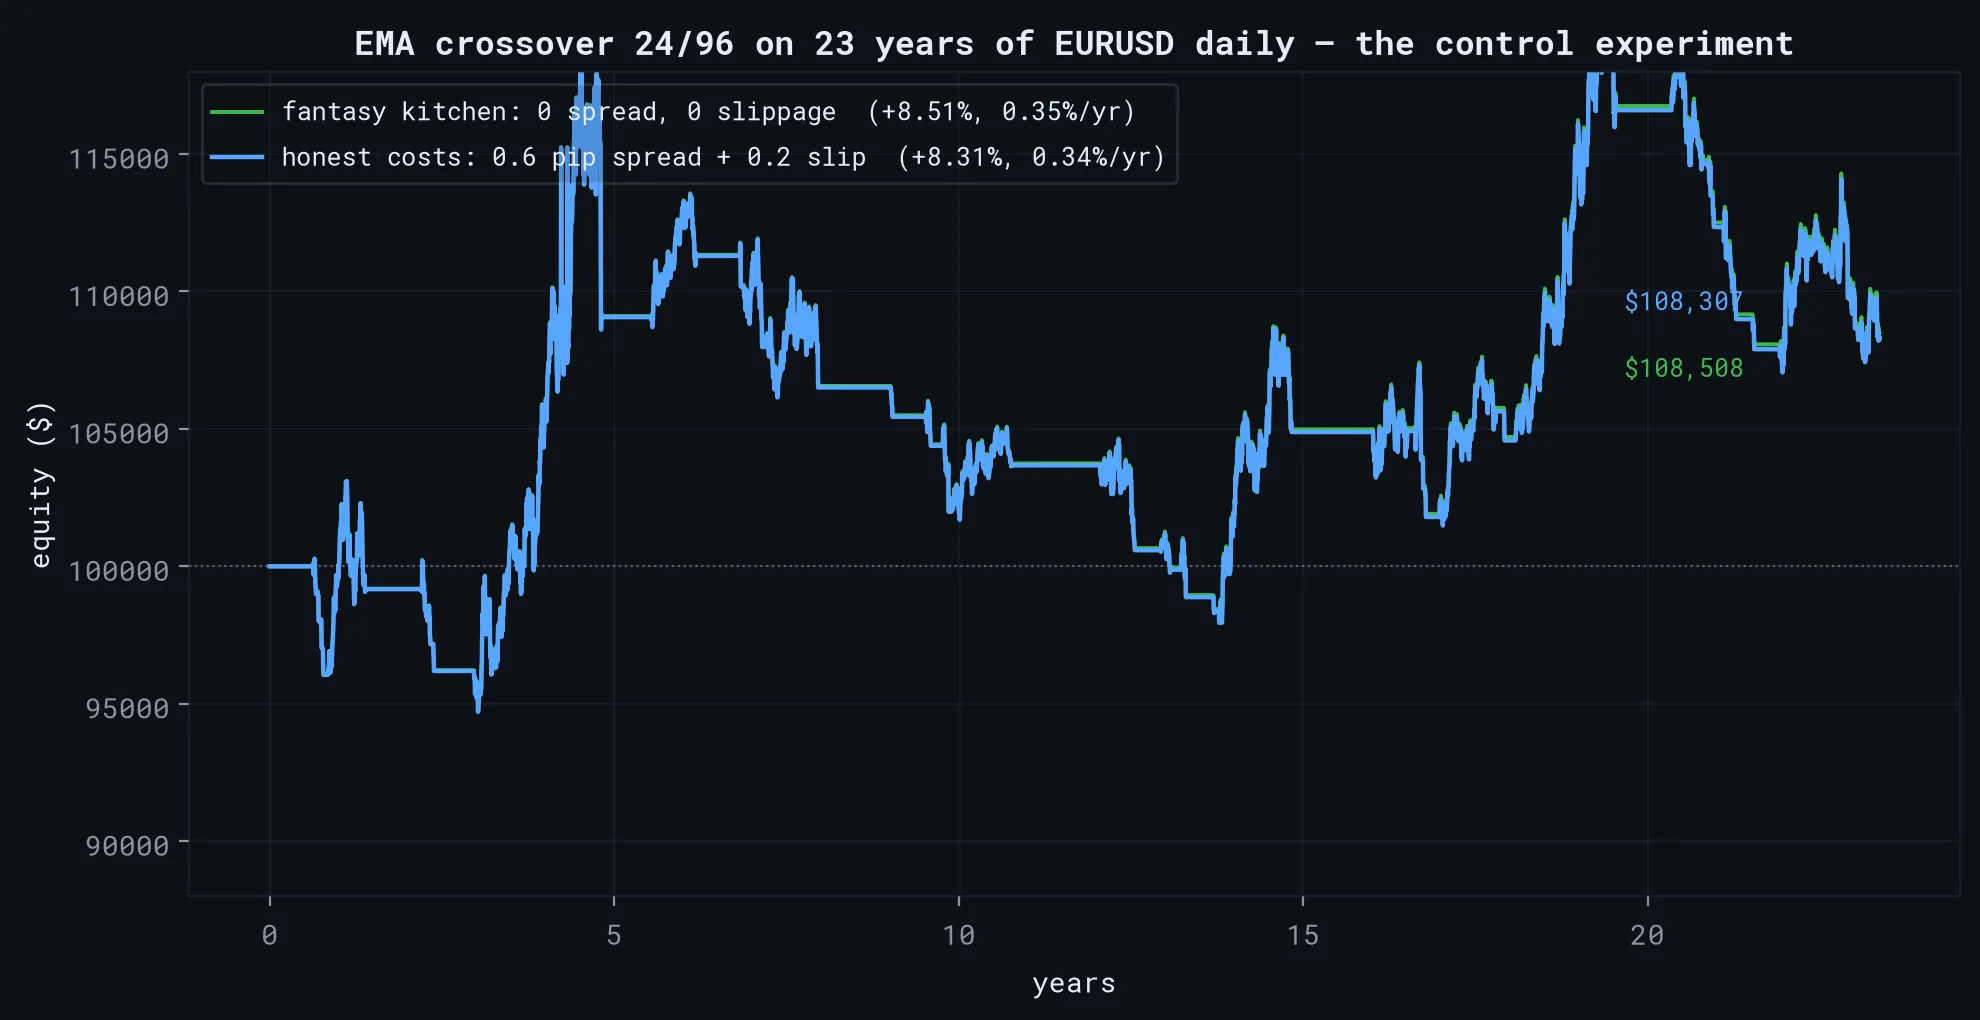
That’s the surprise. Daily EMA trades forty-nine times in 22 years — about twice a year — so trading costs are almost irrelevant to it. It’s not the costs. It’s the strategy. Even with free execution, the most famous strategy in retail trading earns 0.34% a year on the most traded currency pair in the world, while carrying a 17% drawdown.
This matters because it tells you where all the fantasy lies and the damage it causes. It’s not on slow daily systems — it’s on the high-frequency scalpers, the “+180%!” ads. For those, execution costs are a third or more of every win. A scalper that prints profit at zero spread and dies at a realistic spread is the cleanest possible demonstration of a strategy that was always just a cost assumption.
That’s the test to ask for. Not “does it make money?” — “does it make money at a realistic spread, on data it was never shown, with fills the market would actually have granted?”
The two tests no vendor shows you
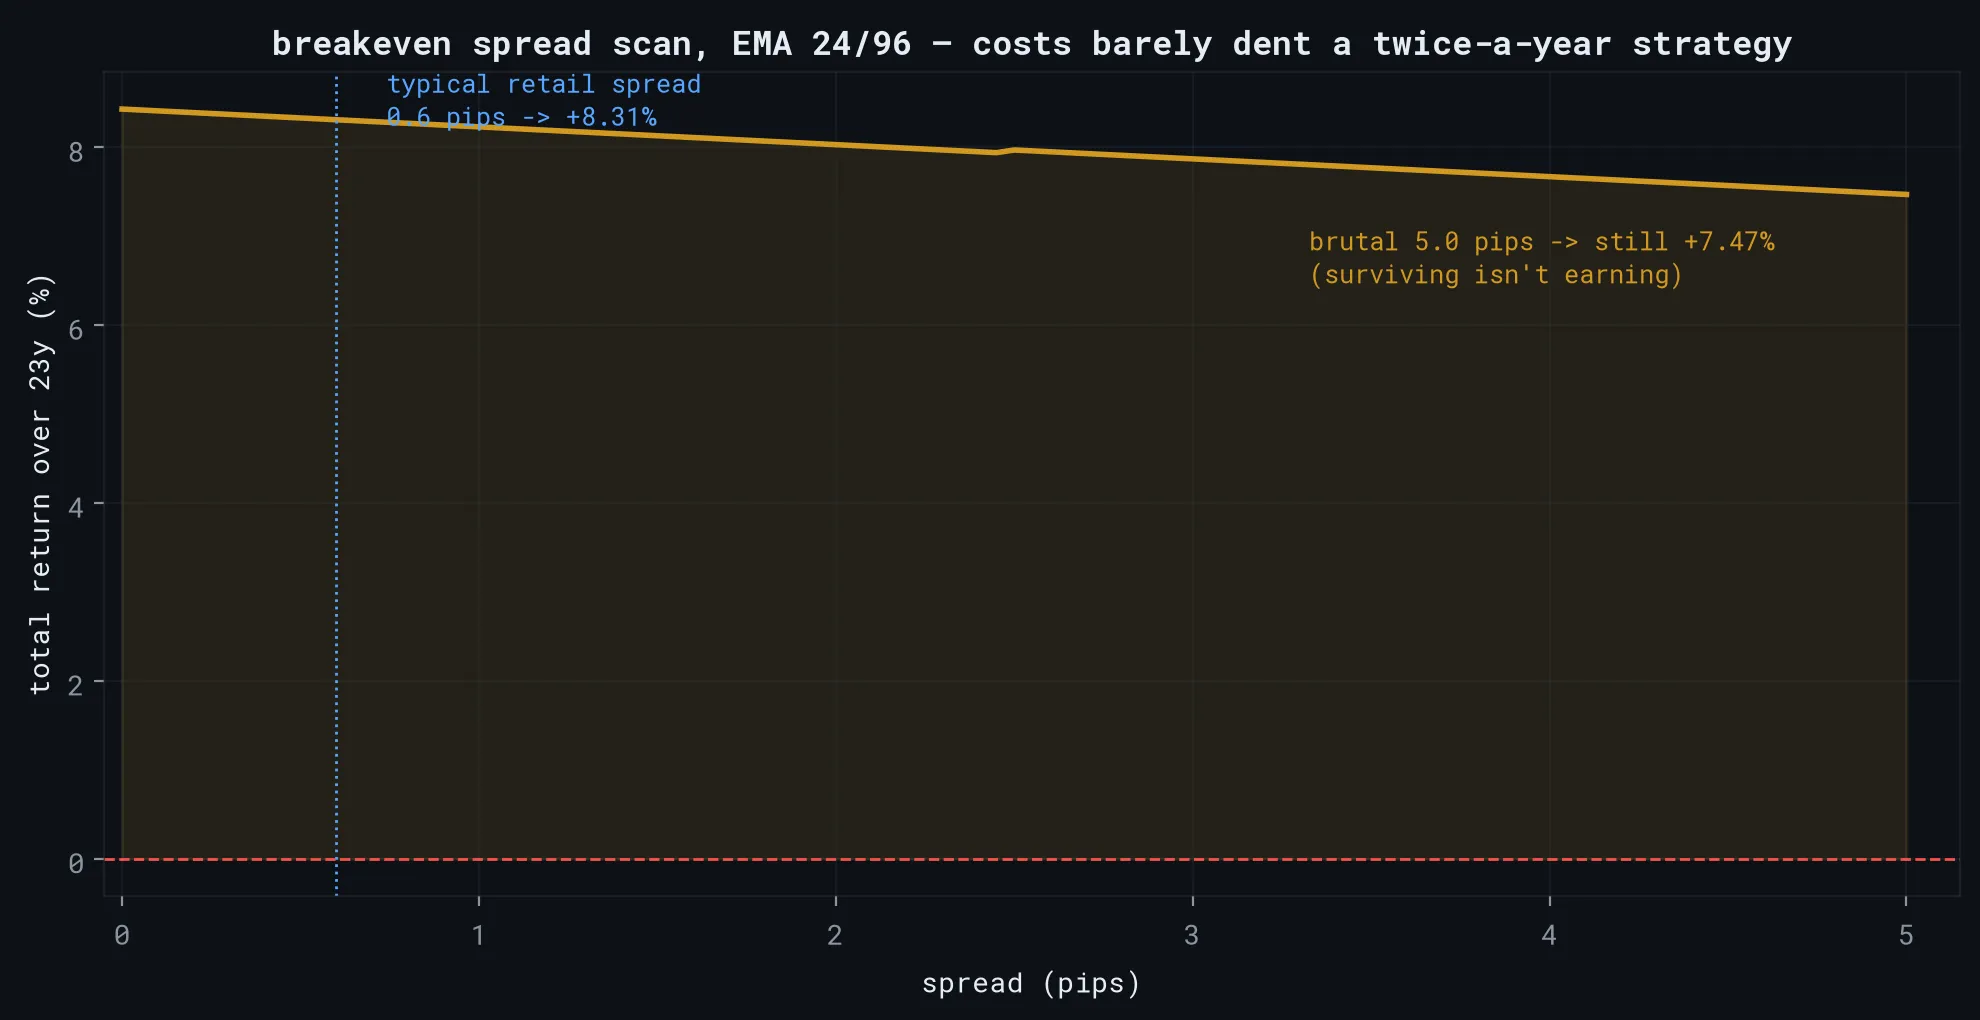
The breakeven spread test. The most optimistic assumption in any backtest is the cost of trading. So I asked, “at what spread does this strategy stop making money?”. The answer is: it doesn’t. Even at 5 pips it technically survives. But surviving isn’t earning. It survives 5 pips of spread and earns 0.34% CAGR. The edge was never real. The cost assumption was just low enough to hide that.
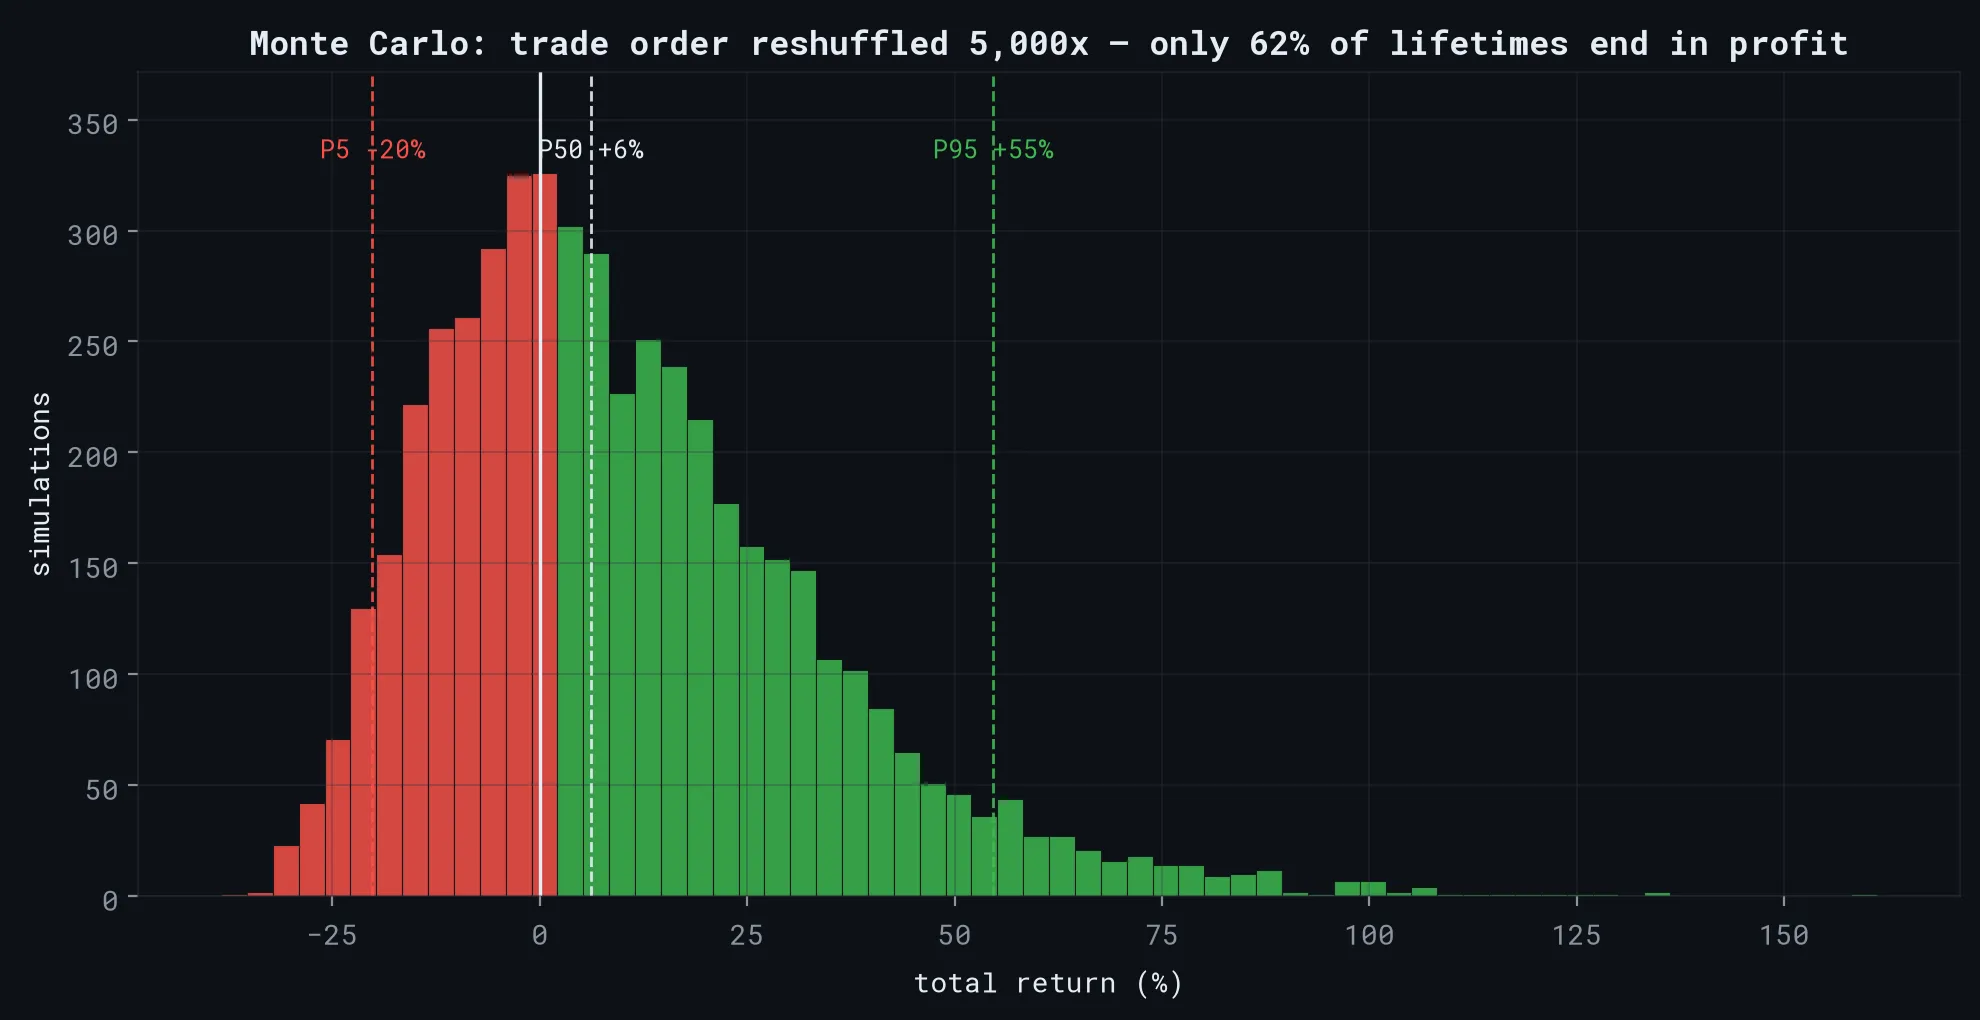
The Monte Carlo test. The results of a backtest depend on the order your wins and losses happen to arrive in. I resampled the actual trade sequence 5,000 times. The strategy ended in profit 62% of the time. That tells us the observed profitability depends heavily on the particular sequence of trades rather than being robust across plausible reorderings. 62% isn’t the kind of robustness I would want to see before calling something an edge.
The honest verdict
The classic indicator strategies are zombies on daily EURUSD after costs. They don’t lose your money — they just don’t earn it. And that’s worse, because it’s harder to detect. A strategy that loses is a strategy you abandon. A strategy that crawls sideways for 22 years is a strategy you keep believing in while it quietly underperforms a savings account at 17% drawdown risk.
And this is the best case, tested with honest fills. The version you see advertised, with the fantasy fills and the zero spread, shows the same strategies printing claims that survive exactly zero of these tests.
Here’s what I learned:
- The people selling “proven” robots know this. You don’t survive in that market by being honest; you survive by showing a pretty picture that can’t survive honest scrutiny.
- A backtest is only as honest as its engine, and the default engines are optimistic by construction.
- In-sample performance is evidence of what happened during optimization — not evidence that the strategy will generalize. Out-of-sample testing isn’t optional; it shows the real deal.
Show your work
Every number in this article is reproducible. Each run recorded:
- Dataset SHA-256 hash
- Exact date range and bar count
- Strategy parameters
- Spread and slippage assumptions
- Execution rules (next-open fills, gap-through-stop)
- Risk settings
- Code version
Any of these runs can be reproduced bit-for-bit and checked independently. Every chart in this article is plotted directly from those run exports — equity curves, sweep grids, walk-forward folds, the spread scan and the Monte Carlo resamples. That’s the standard I’m holding this article to — and the same standard I’ll hold every strategy I’m sent.
Where this goes next
The engine is done, and it has done what it was built for; proving that the tools of the trade produce fiction.
Most expert advisors — the trading bots people buy — are sold as compiled, encrypted binaries. You literally can’t read what they do. And that’s a problem too, because what they say they do and what they actually do are often not the same:
- Martingale in disguise. Position size grows after every loss, until one bad streak wipes the account. Sold as a “safe scalper”.
- Hidden stop-loss deletion. The “safety stop” the ad promises is quietly widened or removed after entry.
- Unexpected external calls. Bots that phone home or touch resources the strategy shouldn’t need.
So the next layer of this work is EA forensics: building a sandbox that runs a robot in a controlled environment and watches what it actually does — every order, every modification, every external call — then decompiling what’s possible and running the true extracted logic through this same honest engine.
The principle I’ll follow with every finding: observation → evidence → interpretation. A forensic report states what was observed and what the evidence shows. It doesn’t declare intent, it shows receipts.
The goal, in one sentence: certify what’s actually running on your account, not what was sold to you.
Invitation
I want to test my own conclusions properly, so I need people to try to prove me wrong.
If you have a strategy you believe in — indicators, price action, anything with clear rules — send it to me and I will run it through the engine and show you the result, honestly, with every number verifiable. I’m not selling anything and I’m not asking you to trust me; the data, the parameters and code version are in every report. You can check the work yourself. If you share a proprietary strategy with me, I will only publish results with your explicit permission.
And if you’re about to buy a trading bot, send the claims it’s making. I’ll show you what it looks like at a realistic spread, on data it was never shown.
The engine doesn’t have opinions. The data passes judgement.
This is a research project, not investment advice. It answers whether a claimed backtest is trustworthy, not whether to trade. Past performance is not indicative of future results. This article is emphatically not a recommendation to trade anything.
Next reads
View all →9 Sept
Mini-Readelf: Gluing It All Together
The capstone. Four parts of pieces, headers, sections, symbols, relocations, joined into one tool that reads any ELF. The only new mechanic is the sh_link chain: offset into a table that holds offsets into a table that holds strings.
5 Sept
Relocations: How PIE Binaries Fix Their Addresses
A PIE binary can't write final addresses because ASLR moves it. The linker leaves placeholders and the loader patches them after mapping. That's a relocation: R_X86_64_RELATIVE, GLOB_DAT and JUMP_SLOT.
4 Sept
Symbol Tables: What Function Names Actually Are
Function names in a binary are just entries in a table. Two tables actually: .symtab and .dynsym. Here's what each is for, how the struct works, and how to resolve a name from an address.
Get posts by email
One email when I publish, not a drip, not weekly. Sign up and I'll only write when there's something new.
You won't get mail just for signing up. Unsubscribe any time.